The TL;DR
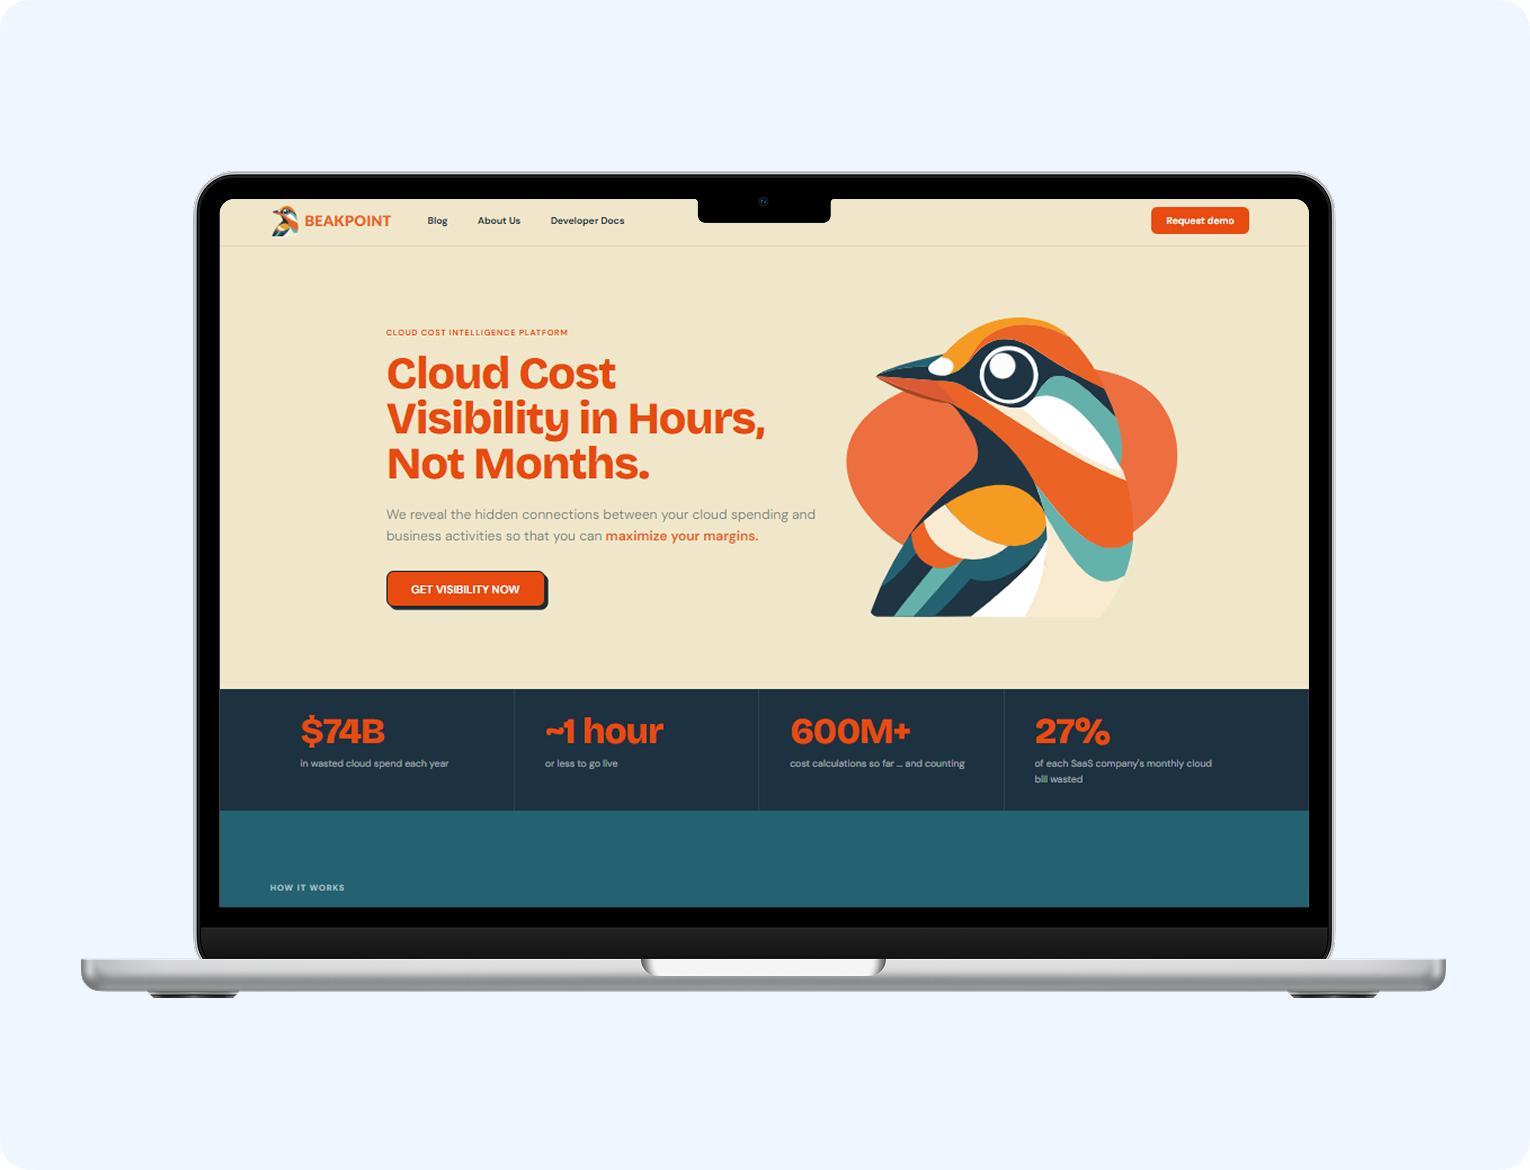
Beakpoint Insights operates in cloud cost intelligence, the category most people now call FinOps. Their job is to help engineering and finance teams understand what they’re actually spending on AWS and Azure, and where that money is going.
Before they brought in YOUR R&D, that job was harder than it needed to be. Cost data lived in two separate silos, one per cloud provider, with no shared structure between them. Getting one trustworthy number for “what did we spend on compute last month” meant manual reconciliation across two very different billing formats.
The backend processed telemetry data one record at a time. That held up fine at a small scale. Once client accounts started generating millions of records a month, jobs that used to finish overnight started running into business hours. Analysts were often working from cost data that was already a day or two stale.
There was no unified interface either. Users couldn’t filter by date range, granularity, or resource grouping in one place. Every deep dive into a cost spike meant exporting data and rebuilding the analysis in a spreadsheet.
For a company selling cost visibility as its core product, that gap was a real liability. In our experience, FinOps tools live or die on speed. If it takes a day to explain why a bill spiked, the answer arrives after the decision that mattered.
The hard part wasn’t drawing charts. Plenty of teams can wire up a dashboard. The hard part was making the numbers underneath those charts fast, accurate, and comparable across two clouds that price and structure things very differently.
AWS and Azure don’t organize billing data the same way. Resource naming, granularity, and even what counts as a “unit” of usage vary between the two. Any cost calculation engine has to normalize that before a single chart can be trusted.
Then there’s scale. Telemetry data, built on OpenTelemetry, arrives continuously. A platform built for real-time cost tracking can’t afford to treat cost attribution as a nightly batch job. It has to keep up as data lands.
The original per-record processing approach didn’t scale. Querying the database once for every record, multiplied across millions of records a cycle, turned into the single biggest bottleneck in the system. This is arguably one of the most common traps in early-stage data platforms: an approach that looks clean in a demo becomes the thing that quietly kills performance at real volume.
We built a full-stack analytics platform split across two layers: a .NET backend for ingestion and cost calculation, and a React frontend for exploration and visualization.
On the backend, we replaced the record-by-record database calls with batch processing using SQL joins. Instead of asking the database the same question a million separate times, it answers the question once across a properly joined dataset. That single change did most of the heavy lifting on performance.
We also built CostScout, a module purpose-built for cost tracking and trend analysis. CostScout pulls live pricing data from both the AWS and Azure pricing APIs, then applies a custom, trace-based distribution algorithm to attribute shared infrastructure costs down to the resource level. That part is often the trickiest piece of any FinOps engine: real infrastructure costs rarely split evenly, and a naive average produces numbers nobody trusts.
Telemetry ingestion runs through Azure Functions, giving us a serverless pipeline that scales with data volume instead of a fixed server that either sits idle or falls behind.
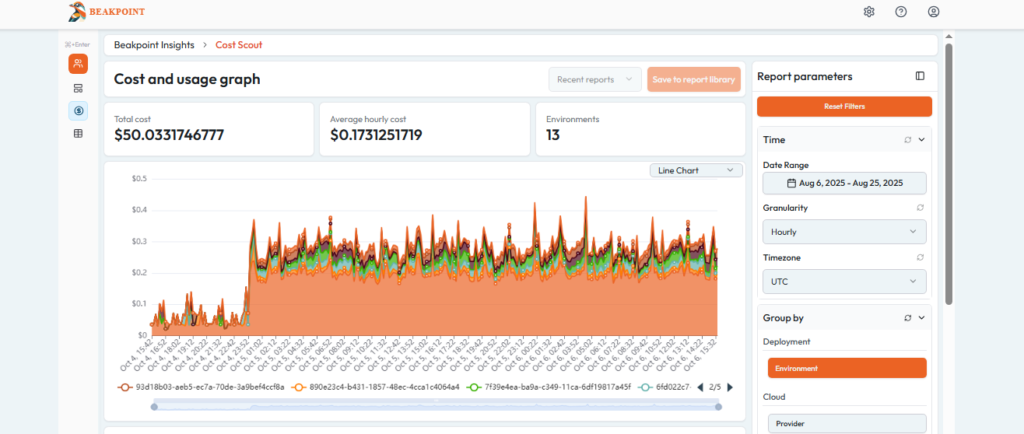
On the frontend, we built the dashboards in React and TypeScript, using TanStack Query for data fetching and Jotai for state management. That pairing kept the UI responsive even while a user filtered across millions of underlying records. Charts run on ECharts, with live tooltips and filters for date range, granularity, and grouping.
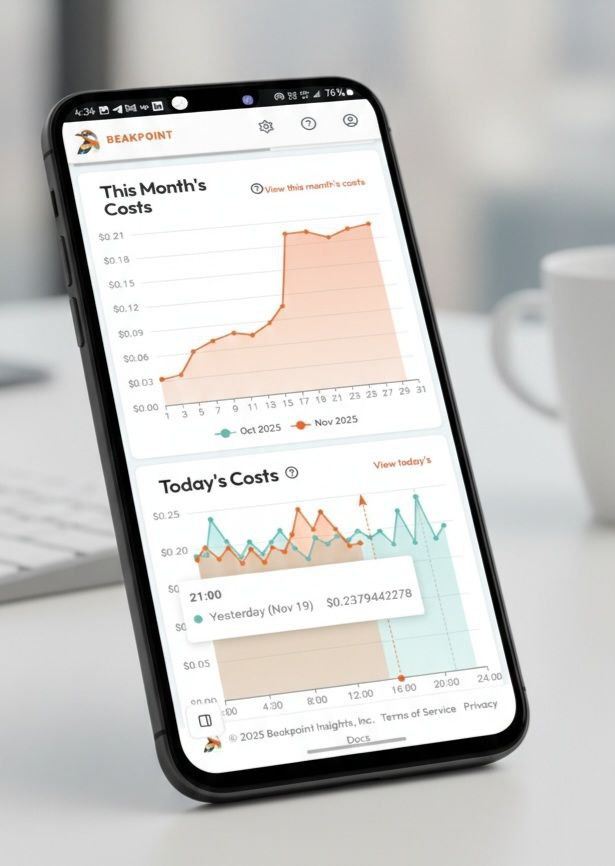
The interface also had to work on a phone, not just a laptop at a desk. We built it mobile-first with Tailwind CSS, so a stacked single-column layout on mobile expands into a full multi-column dashboard on desktop, without maintaining two separate designs.
For a CTO deciding whether to build this kind of system in-house or bring in outside engineering help, the 85% figure is the one that matters most. It’s the gap between a cost platform that tells you what happened yesterday and one that tells you what’s happening now, while there’s still time to act on it.
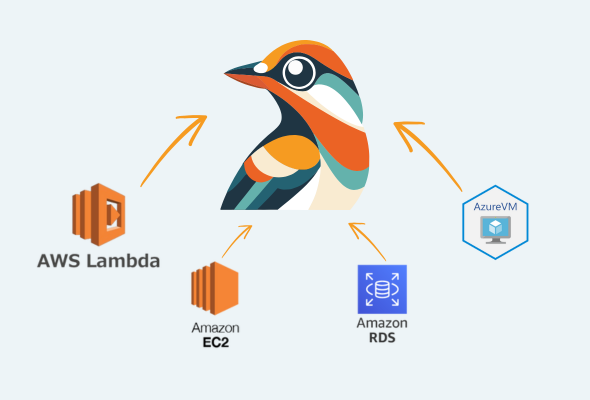
High-scale analytics comes down to two things: efficient data processing and cost algorithms that hold up under real usage, not just clean demo data. Get either wrong early, and you end up rebuilding under pressure once real traffic arrives.
The architecture decisions made in week one, serverless versus a dedicated pipeline, per-record versus batch processing, are usually the ones that decide whether a platform holds up at scale or needs a rewrite in year two. Beakpoint Insights got most of that right the first time, with room to grow into event-driven, streaming architecture and cost forecasting as the next steps.
If you’re building a cloud cost analytics platform, or any system that has to turn a flood of raw telemetry into numbers a finance team can act on, we’ve done this before. Let’s talk about your project.